NS&I 2017-18 Annual Results - New strategy 2018-2023: Inspire & Invest
-
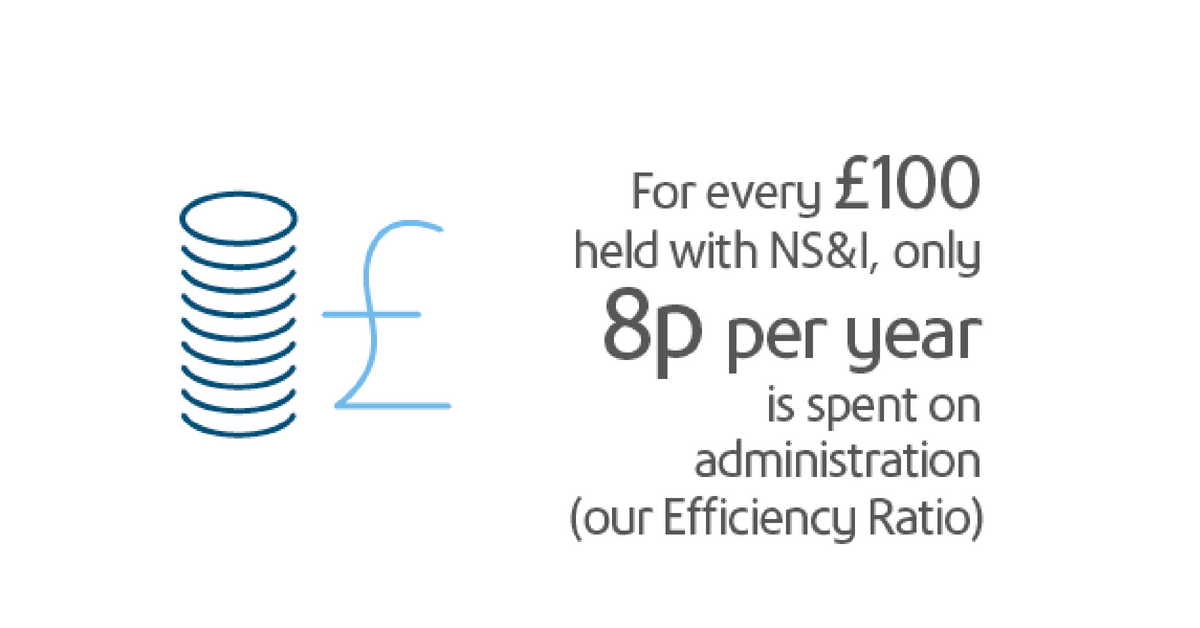
NS&I delivered £9.8 billion of Net Financing and £229 million of Value Indicator savings to the taxpayer in 2017-18 - NS&I’s efficiency ratio improved again, moving from 9.4 basis points to 8.0 basis points – meaning that it costs NS&I 8p a year to manage each £100 of stock held
- New five-year strategy, Inspire & Invest, launched
NS&I today announced its 2017-18 annual results for the year to 31 March 2018 and launched its new business strategy: Inspire & Invest. Key points from NS&I’s annual results include:
Net Financing
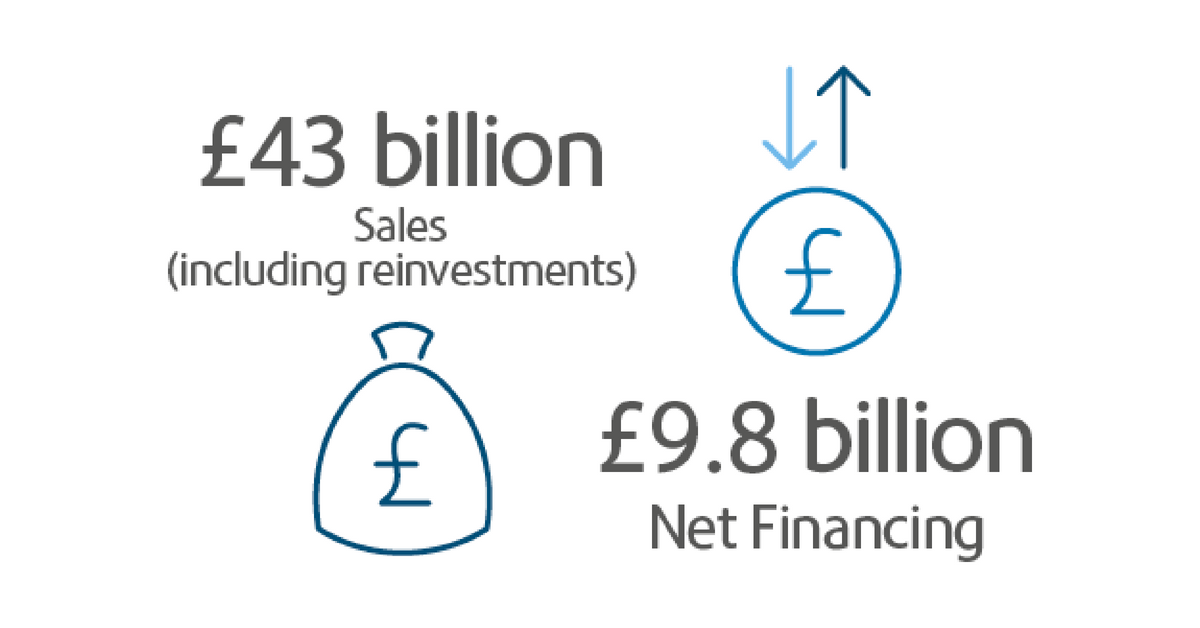
NS&I delivered £9.8 billion of Net Financing in 2017-18, compared to the forecast at the 2018 Spring Statement of £10.2 billion. This is above the revised Net Financing target of £8 billion (within a range of £5 billion to £11 billion) that was set out in the Autumn Statement in November 2017.
The Net Financing outturn of £9.8 billion in 2017-18 reflects high levels of inflows attracted in the period following the return to sale of Guaranteed Growth Bonds and Guaranteed Income Bonds on 1 December; and NS&I passing on the 0.25% rise in the Base Rate announced by the Bank of England in November 2017, to some of its variable products, also on 1 December.
Value and efficiency
Value Indicator (a measure used to estimate the relative cost of raising funding through NS&I rather than through the sale of gilts) increased from £74 million in 2016-17 to £229 million in 2017-18. This is in line with the target range set at the Budget in March 2017 to deliver £250 million of value for the taxpayer, with a lower limit of -£100 million. NS&I’s efficiency ratio – how cost effectively NS&I manages the funds it holds – improved once again in 2017-18, moving to 8.0 basis points (against 9.4 basis points in 2016-17). This means that that it costs NS&I 8p a year to manage each £100 of stock it holds.
Service Delivery Measures 2017-18
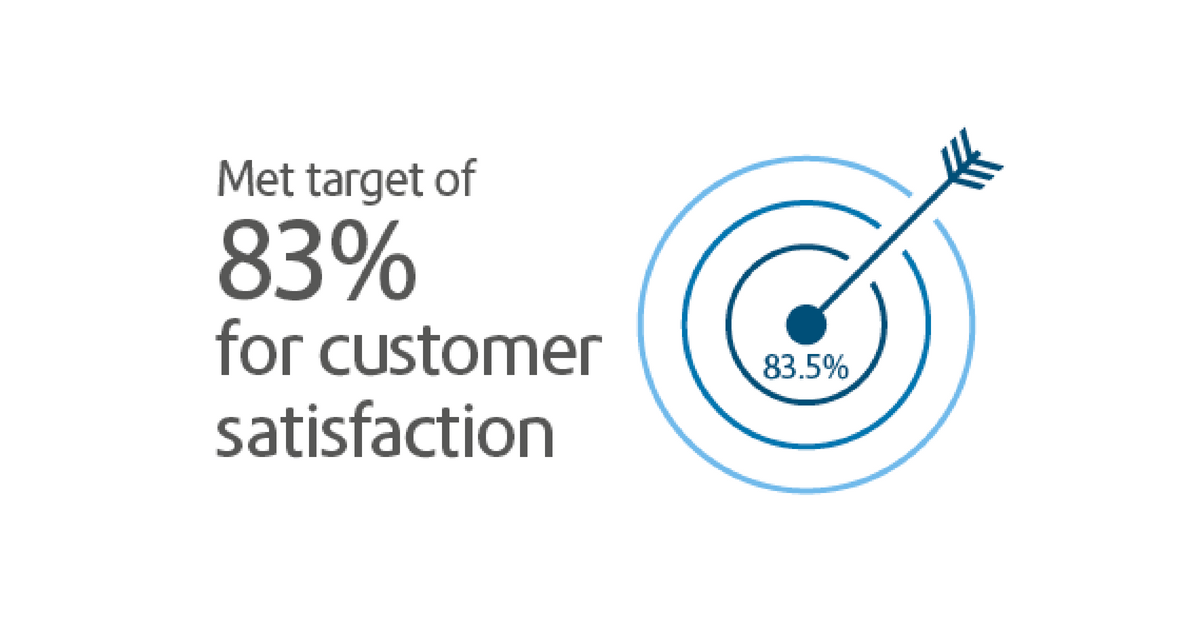
Overall customer satisfaction this year was 83.5%, meeting NS&I’s target of 83% and up from last year’s 82.1%. NS&I’s customer satisfaction target for 2018-19 is at least 84%. NS&I also met its other customer service targets for timeliness and accuracy in 2017-18, along with its Service Delivery Measures for fraud and customer complaints.
2018-19 targets and Service Delivery Measures
The 2018 Spring Statement confirmed that NS&I’s 2018-19 Net Financing target is £6 billion, within a range of £3 billion to £9 billion. NS&I’s Value Indicator target in 2018-19 is to deliver £125 million of value with a lower limit of £0 (zero). In addition to a range of existing service delivery measures, NS&I now also has a specific Service Delivery Measure on diversity, with targets to maintain gender balance in senior management and to improve Black, Asian and Minority Ethnic (BAME) representation in management across the business.
NS&I’s new strategy: Inspire & Invest
NS&I’s new business strategy, Inspire & Invest, launched on 1 April 2018. It sees continued focus on delivering sustainable cost-effective financing for the Government as NS&I’s core purpose. The strategy will ensure that NS&I continues to resonate with savers in a highly competitive savings market through developing products, services and a customer experience that are simple, straightforward and user-friendly. In an era of open-banking, the business will focus on continued relevance and accessibility while building appeal with younger savers.
Inspire & Invest also embeds NS&I’s business-to-business offer, which provides payment processing services to other parts of government; and sets out a role for NS&I in helping government deliver its policy objectives by utilising NS&I’s knowledge and expertise in the savings sector. For more information on Inspire & Invest and NS&I’s strategic objectives for 2018-2023 please see: https://nsandi-corporate.com/governance/strategy
Ian Ackerley, NS&I’s Chief Executive, said:
“I am pleased that NS&I performed strongly in 2017-18, delivering £9.8 billion of financing to the Government; increasing the Value Indicator return from £74 million in 2016-17 to £229 million; and delivering two new products, as well as putting two popular products back on sale for the first time in nearly 10 years.
“During the year we have also developed and launched our new business strategy – Inspire & Invest – which will drive NS&I forward over the next five years. The strategy will create value through: delivering cost-effective financing, providing services to other parts of government; and by helping the Government deliver policy objectives. It builds on our current capabilities and successes and will see us also focus on supporting a strong savings culture in the UK, as well as using our expertise and insight to serve other parts of government.”
Inspire & Invest is the successor strategy to Think Ahead, which ran from 2014-18 and saw NS&I deliver £50 billion of Net Financing to the Exchequer and more than £780 million of Value Indicator savings to taxpayers; launch policy products on behalf of the Government to support savers who have been affected by low interest rates (65+ Bonds and Investment Guaranteed Growth Bonds) and saw NS&I become a 100% direct business. In the period, the business grew by around 50%, with operating costs being reduced by around 20%.
2017-18 annual results
| Year |
Gross inflows (including reinvestments) |
C&AIP* |
Gross outflows |
Net Financing |
Total stock £bn |
Value Indicator £bn |
|---|---|---|---|---|---|---|
| 2017-18 (including Q4) |
42.7 | 2.5 | 35.4 | 9.8 | 156.7 | 0.2*** |
| 2016-17 | 35.0 | 2.3 | 25.5 | 11.8 | 146.9 | 0.1** |
| 2015-16 | 31.5 | 2.1 | 22.3 | 11.3 | 135.1 | 0.1** |
| 2014-15 | 32.3 | 1.6 | 15.7 | 18.2 | 123.9 | 0.3** |
| 2013-14 | 16.4 | 2.0 | 14.9 | 3.5 | 105.7 | 0.3 |
| 2012-13 | 11.7 | 2.3 | 14.7 | -0.7 | 102.2 | -0.2 |
All figures are in £ billion and are subject to rounding.
*C&AIP is capitalised and accrued interest and prizes earned. All figures are in £ billion and subject to rounding.
**Excluding 65+ Bonds.
***Excluding 65+ Bonds and Investment Guaranteed Growth Bonds.
NS&I reports quarterly on gross inflows and outflows, Net Financing and total stock. Each quarter, NS&I releases unaudited figures and publishes its audited Annual Report and audited accounts each financial year. NS&I’s full Annual Report and Accounts and Product Accounts 2017-18 can be found here: https://nsandi-corporate.com/sites/default/files/2018-06/NS%26I_Annual_Report_2017_18_Complete_website_version_0.pdf
Notes to Editors
- NS&I is one of the largest savings organisations in the UK, offering a range of savings and investments to 25 million customers. All products offer 100% capital security, because NS&I is backed by HM Treasury.
- Net Financing – the measure of the net change of NS&I funds, meaning total inflows from deposits, retention of maturing monies and capitalised and accrued interest, less the total outflows from withdrawals and interest or Premium Bonds prize draw payments. A positive Net Financing figure represents a positive contribution to government financing.
- The original Net Financing target for 2017-18 published in the NS&I 2016-17 Annual Report was £13 billion (+/- £3 billion). However, in the Autumn Budget in November 2017, this was revised to £8 billion (+/- £3 billion) due to lower than expected financing delivered in the first half of 2017-18.
- Value Indicator – an indication of NS&I’s cost-effectiveness in raising finance for the Government. It compares the total cost of delivering Net Financing and servicing existing customers’ deposits with how much it would cost the Government to raise funds through the wholesale market via equivalent maturity gilts. 65+ Bonds are not included in the Value Indicator. As they were a specific Budget measure, the cost for delivering them was set out in the 2014 and 2015 Budget scorecards. Investment Guaranteed Growth Bonds are a specific measure announced at the 2016 Autumn Statement and are not included in the Value Indicator.
- Full details of NS&I’s new business strategy, Inspire & Invest, can be found here: https://nsandi-corporate.com/governance/strategy
